
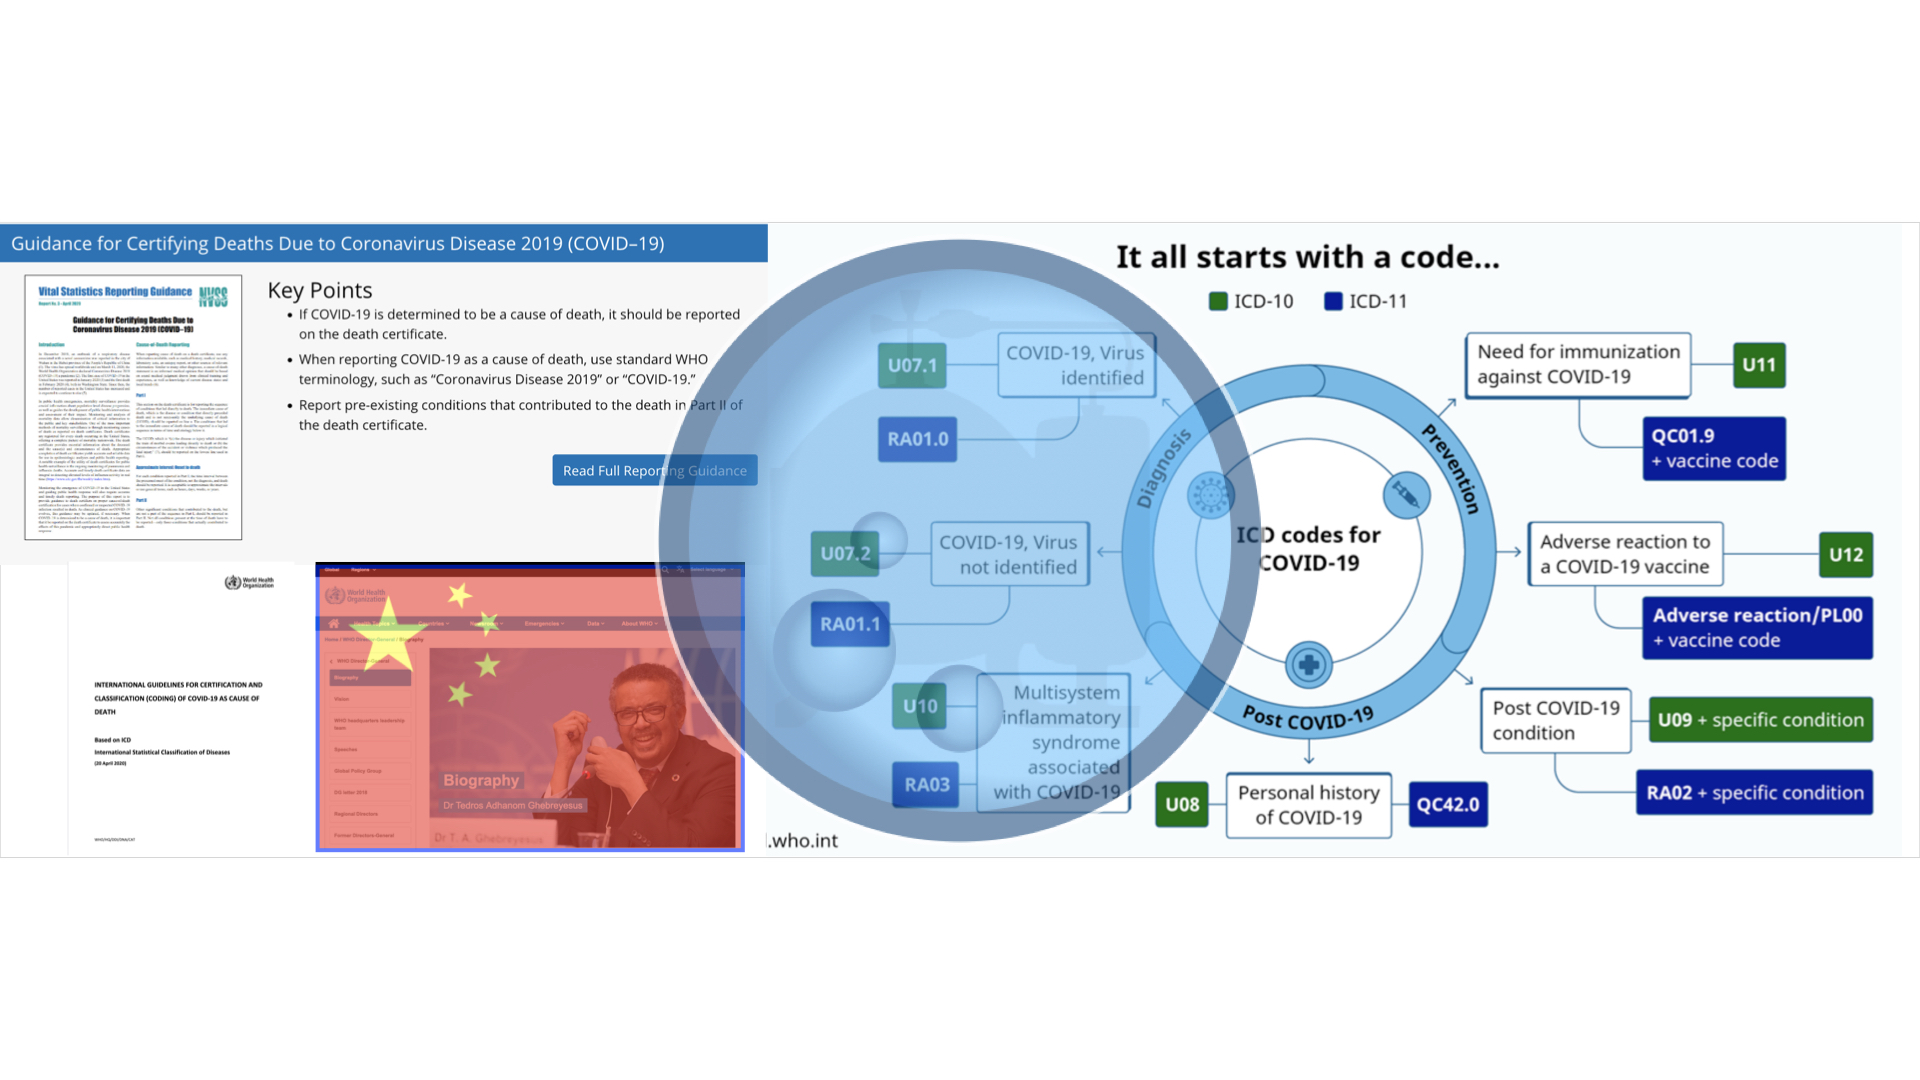
It all starts with a code. Those are the first five words atop the World Health Organization’s page delineating the ICD-10 and Emergency use ICD codes for the COVID-19 disease outbreak. The key work here is “emergency.” Most everything being done do Americans is being done under a fraudulent and perpetual state of “emergency” constructed by enterprise fraud and serving as a direct circumvention of lawful and constitutional governance.
Therein, coding is facilitating the literal overthrow of the United States of America and the evidence is rather clear that it’s all being obfuscated by design to veil it from the American people. Such is the nature of enterprise fraud.
Through the ICD-10 as applied to the diagnostic guidance issued by the US National Vital Statistics System to medical providers, the mechanism of coding is permitting China to steer internal U.S. COVID-19 data formulation and curation to desired ends that have been and continue to be disastrous for America and basic freedoms.
The full scope and complexity of COVID-19 data parameters remains to be completely understood as a result from the disaggregated, redundant, compartmentalized and dissimilar data sets the CDC puts forth.
What is certain is that if this were an authentic pandemic with authentic infection and mortality data, none of the following analysis would be necessary to understand basic things like how many people got it and how many died from it.
Far from it.
These data sets are anything but simple to comprehend.
What follows is really for the informed reader and veteran Moonshiner. It’s an exhibit of 41 evidentiary slides respective to comprehending COVID-19 as a construct of enterprise fraud. Importantly, this exhibit builds on firmly established, existing and exhibited evidence of COVID-19 being an enterprise fraud construct leveraging a closed-loop system to propagate harvested co-morbidity data as COVID-19 data.
If that sounds unfamiliar and a quick tutorial is needed, take a quick spin through the timeline with particular attention to the handful of graphics beneath it.
To start, we’ll work through the data sets primarily from two tables. From there, we’ll examine the lane that merges China’s policy and US internal COVID-19 data sets.
Instead of written text the exhibits below are presented for your full consumption for you to gain understanding. They present with limited text in between except for a place or two.
We begin by vetting our own position over a long timeline.
Consider the middle image in the following graphic – “COVID-19 Weekly Cases and Deaths.” This recent data line overlaid with the current flu data vets our established co-morbidity harvesting position over time and it provides evidenced bedrock for what follows. Co-morbidity data will be closely examined.
The graphic is a simple overlay that verifies the continuance of co-morbidity harvesting to predicate a fictional but perpetual state of emergency.


The data never lies. Even when it does. Position fully confirmed.
As we attempt to better understand the CDC’s complex and intricate COVID-19 data sets, it’s important to review some basic context about them noting existing positions that question the apparent compartmentalization of COVID-19 data in 37 “selected hospitals” that remain unidentified and receive competitive discretionary funding [in exchange for their data?].

The graphic below accurately and appropriately situates China in the correct geopolitical context respective to our enterprise fraud work here. It’s an exemplar for a constructed narrative by China/WHO/Criminal Enterprise and we note the statistically outlying probability of the scenario.
We also note the significance of the mid-April shift and expanded testing respective to expanded cases [by design].

Moving deeper into the granular data, the following graphic indicates our direction as we come to understand how COVID-19 data is generated and how that process is shaped by a merger of dynamics from China and the Criminal Enterprise.
It’s critical to recall that the RT-PCR test and the NVSS memos are two established primary data drivers for the enterprise fraud construct and this detail should underpin all that follows.
The merger we’re examining establishes a lane for China to steer internal US COVID-19 data and at the same time it establishes correlation in the two CDC data sets being used here. Our primary focus will become the Tables 1 & 3 data with 3 appearing in-part here at the bottom right.

Here we expand further into mortality data and we note the continued constructive elements of enterprise fraud/RICO as indicated.

Mortality is the benchmark measurement for pandemics and so the particulars of how mortality is determined, recorded and propagated is essential. We therefore examine the cause of death and death certificate completion protocols noting the identified portal for fraud permitting a 5-8 week rolling window of provisional death data and death certificate issuance protocols that leverage backend revisions [5-8 weeks later.]
This allows a perpetual cycle of constructively establishing data, taking action on that data and then revising away that data on an inconsequential backend once the so-called damage is long done.
This mechanism rolls in time with a 5-8 week effective window [the CDC defines peak flu as an 8-week window beginning every 01 Dec] beginning on the initial issuance of each death certificate. This means that at the individual death certificate level and for an undetermined amount of death certificates [95% of them?] for 5-8 weeks the provisional death data could be incorrect. There are two evidenced bulk data revisions for sole-cause COVID-19 mortality data: 26 Aug 20 [94%] and 12 May 21 [95%.]

This is critical for understanding as we latch on to coding [U07.1] relative to death certificates, cause of death and provisional death counts.
ICD-10 Code U07.1 derives from the WHO. It’s the emergency coding system established by the WHO that permits fraudulent data manipulation by means of death certificate issuance and provisional death counts that create massive portals for enterprise fraud in the 5-8 week rolling window.


The established “problematic data point” of [2020] mortality and the bulk data revisions required because of it draw this into conflict like with all else. In particular, we note the 5%-5% figures in both data sets [this is presented in more detail below.] They exactly represent the data the fraud construct [Table 3] below purports as being valid sole-cause COVID-19 data and then propagates but which later requires backend revisions for reconciliation.
Those backend revisions are already evidenced in two consecutive years of patterned RICO activity.

Here we source our Table 1 and Table 3 data.

Here the tables present completely as acquired from the site. Pay particular attention to the footnotes – they are important [fraud lives in the footnotes.]

Recalling our initial graphic overlay about co-morbidity harvesting, we focus particularly on any vectors that intersect it. Here’ we’re examining Table 1 deaths respective to the 4 categorized footnotes. Further, we examine how the coding [found in the footnotes] impacts the data sets and in what ways.

To render the coding data [ICD-10 Codes U07.1, J09-18.9 / encompassed in the footnotes], we use the CDC’s Wonder application and immediately make an obvious and glaring data observation. The problematic data point of 2020 mortality is made unavailable on the site.
Only 2019 mortality data is available recalling that COVID-19 was not first announced to the world until 27 Dec 19 and the first US case wasn’t until 20 Jan 20.
This means that the coding data is also unavailable. Examine closely the categories of coded data that are unavailable in a pandemic of coded data from co-morbidities.
It’s all further complicated by understanding that we already possess and have exhibited 2020 mortality data making the CDC’s choices here problematic to logically deduce outside the explanation of enterprise fraud.

This graphic is helpful for processing the complexity of this so we’ll slow down. This is the same Table 1 data from 2 images up. It presents with the footnoted headers alongside 2020/2021 numbers. Those numbers then tie to the ICD-10 coding and from the coding, you can see the individualized ICD-10 codes for the long list of co-morbidities that we evidence being harvested in an enterprise fraud construct.
The math is illogical as is the coding and it requires further and closer examination beyond what is outlined.
It bears the question – why is the CDC suppressing this data? Yes, suppressing it.

Here you see additional evidence of data sourcing along with 2020 mortality data. Again, we note that the CDC is making only 2019 available.

As Table 1 contained all COVID-19 deaths in all 4 footnoted domains, Table 3 contains co-morbidity deaths only in footnote domain 1. First, we begin by examining the introductory notes and footnotes for Table 3 and it’s here we slow down to provide explanations for them [1-4 introductory] and 1-10 footnotes.]

Introductory: 1] Establishes co-morbidities in conjunction with COVID-19, 2] establishes deaths for more than one condition demonstrating a comorbidity data harvesting portal [without coding], 3] “for over 5% [equates to 95% and correlates with the 2020 5% bulk data revision mentioned above: 5%-5%] COVID-19 was the only cause mentioned, and 4] confirms established average of 4.0 underlying co-morbidities.
Footnotes: 1]”Empty data cells represent counts between 1-9 that have been suppressed in accordance with NCHS confidentiality standards,” 2] evidences ICD-10, 3] diabetes and respiratory arrest deaths counted in “both totals,” 4] deaths can have “more than one of the same condition” establishing a direct data harvesting portal, 5] establishes “numbers of mentions” on death certificate as count in death total, 6] incomplete data set drawing distinction between deaths and mentions, 7] data is “a cut from the NVSS data base at a particular time, separate from other surveillance tables,” opening a portal for compartmentalization, 8] data may not match other surveillance data sets, 9] cites lag time and long processing of death certificates for incomplete data creating a massive fraud portal in provisional data counts that roll on a 5-8 week window “or more,” and 10] deaths “confirmed or presumed” COVID-19 are coded U07.1.
Here we note the 5%-5% bulk data deletion in correlation to Table 3.

In the following 4 slides we manipulate Table 3 search parameters to filter the search results for meaning. Our focus is on the 4 established primary co-morbidities: flu/pneumo, heart disease, diabetes and obesity.
Each graphic contains a left image – “Condition Group All” – and a right image – “Condition Group COVID-19.” Both are then filtered for the same co-morbidity. A consistent result is returned for the “Condition Group COVID-19” when it returns an empty cell. The introductory notes tell us that an empty cell is “suppressed data.” The filtered co-morbidity is permitted to underlie the “All” group but not the “COVID-19” group.
Occam’s suggests the filtered co-morbidities are being harvested into COVID data and so they don’t populate back into that group and return the empty cell.
This presents as evidence of data steering/co-morbidity harvesting with compartmentalization and suppression.


With an understanding of the nature and complexity of the data outlined, let’s shift our focus to understand how it was put in place by China through its proxy Tedros and the WHO. For short work, treat these graphics as a virtual tour of the CDC’s/WHO’s pages. Note the identified merger coming from the CDC as it relates to coding. This is where China and the NVSS marry to deliver the ICD-10 to the US and the massive fraud portals it delivers.

Here we note the direct application of ICD-10 down through the NVSS and to medical providers writ large.

Here we note the direct linkage to the WHO’s ICD-10 as it stares us right in the face – “It all starts with a code…” We also immediately grab onto updates already issued to the ICD-10.

The update reflects the current news cycle pertaining to deaths relative to vaccination status, vaccine reactions and other identified areas of importance.

Returning to the document.

The document continues as fully presented.

Here, we take our merger and diverge it so we can compare like samples from the WHO/China on the left and the NVSS/US on the right. Draw your own analysis.


It all starts with a code. The pandemic. The stolen election. The illegitimate Biden administration. The irregular, asymmetrical and undeclared third world war that began in October 2019 with the release of a bio-WMD. All of it. It all started with a code.
The entire COVID-19 pandemic is a construct of enterprise fraud and it all started with a code.
-End-


Leave a Reply to COVID-19 ENTERPRISE FRAUD CONSTRUCT: More Back End Revisions, Pediatric Data – POLITICAL MOONSHINECancel reply